How We Are Leveraging GenBI to Empower SMBs with Self-Serve Analytics
At B/eye, our leadership team has 25 years of combined experience in building enterprise SaaS platforms for business intelligence (BI). We understand the effort it takes not only from software tooling but also from the human capital, particularly DevOps engineers, DBAs, and data scientists, to enable data-driven reporting. This is a costly endeavor for companies, both in terms of money and time invested. Data is an organization’s currency; maintaining it properly and building layers of abstraction on top of systems is essential for informed decision-making. However, implementing this in practice requires deep technical knowledge, building transformation layers, handling large data volumes at scale, meeting SLAs, and ensuring data lineage and accuracy. Identifying and logging exceptions and capturing business rules correctly is no easy feat for an organization using traditional BI tools today.
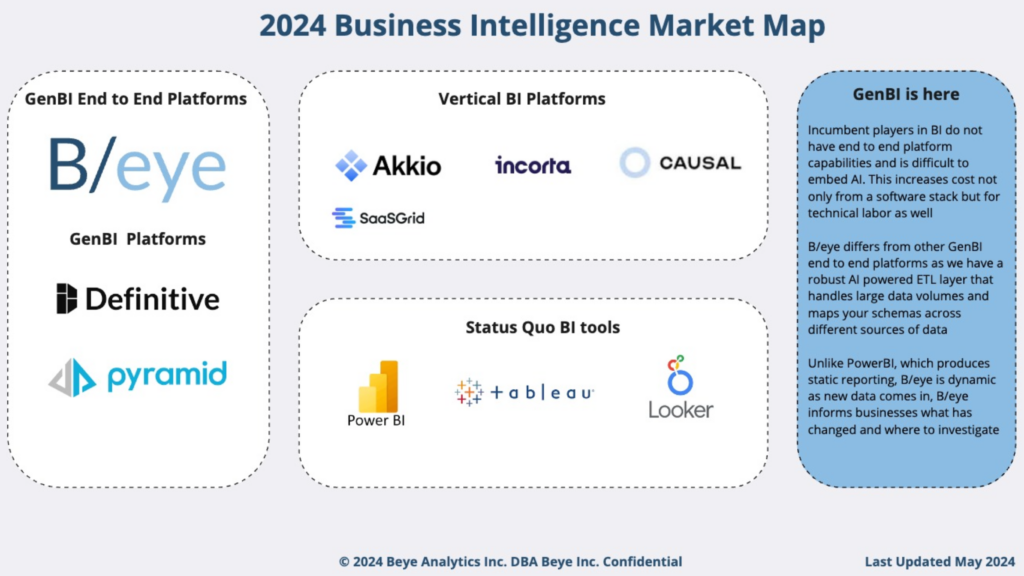
Leading providers like PowerBI, Tableau, and Looker have developed tools that help organizations visualize data after reports are created. As the current standard in BI, they enable organizations to act on information today. However, these tools fall short because implementing them is challenging. Users must prepare data upfront (ETL) to create reports in these tools. This requires deep schema mapping, data standardization, and cleansing, pulling information from disparate systems—all of which involve heavy technical work.
Reflecting on my consulting days, the typical workflow involved business users making ad hoc data requests. Often, they needed to report on certain KPIs, which required documenting these requirements in a ticket. This ticket would then funnel into an IT queue. For IT, it’s just another data pull without full context. Once the data is pulled in a table view, CSV export, or Parquet file, it’s passed to report developers who translate this structured data into a consumable report in PowerBI, Tableau, or Looker. At this point, the business user can finally review the information, often requiring iteration and process repeats to ensure it meets business rules. This may take days, sometimes even weeks, for a KPI report to become actionable. Even then, business users must find the “needle in the haystack” within the data to focus on specific KPIs, identify anomalies, and analyze performance trends.
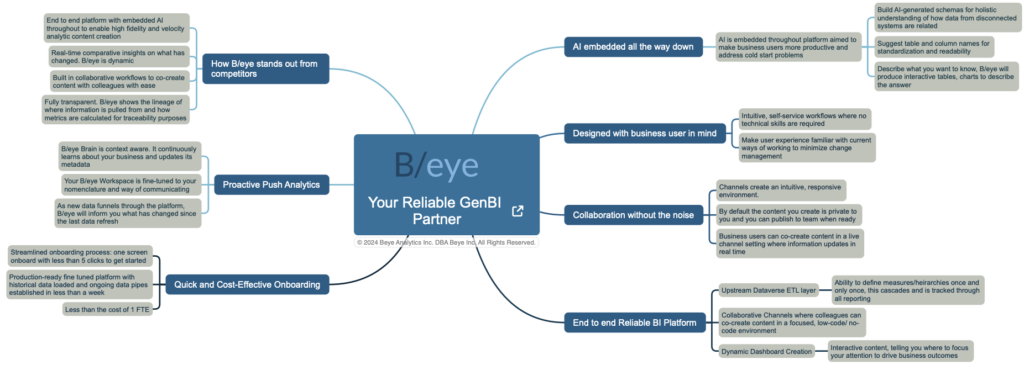
There must be a better way. B/eye offers a solution with our end-to-end generative AI-powered business intelligence (GenBI) platform. This platform empowers SMBs to create analytic content within minutes, tapping into a market with a total addressable market (TAM) of roughly $3B. By leveraging natural language processing and a low-code/no-code data studio, B/eye allows businesses to create highly performant dashboards (rendering over 10 million records) and iterate on them quickly. This enables businesses to make timely decisions with high fidelity. We’ve built workflows with the business user in mind, focusing on intuitive, simple, and denoising design patterns. Unlike static reporting tools like PowerBI, which require users to search for key insights, B/eye proactively informs users about opportunities within the data. Additionally, as new data comes in and reports are updated, B/eye offers comparative views that highlight changes in business metrics, helping users understand KPI trends and their key drivers.
A typical onboarding journey for an SMB with B/eye involves a streamlined process. Users can onboard with just three clicks, updating basic information at the Workspace level and establishing their first data connection, such as a single CSV file. Within 30 seconds, the workspace is created, and users can start realizing the value of B/eye. Comprehensive documentation guides usage, but the design is intuitive. Users begin in the Dataverse, establishing data connections from disparate sources (e.g., CSV, ERP, PoS, data warehouse). B/eye securely creates a copy of this data in our cloud storage, with data encrypted at rest and in transit. During this process, B/eye creates a schema mapping of the data to fine-tune the Workspace to the business’s needs, including data definitions, verbiage, and KPI calculations. Business users can cleanse data in the front end, while the B/eye Brain (our AI engine) proactively standardizes and cleanses the Dataverse (e.g., table names, column names, data types). Often, a Dataverse represents specific topics or collections of topics relevant to the business, such as optimizing inventory allocation across retail locations using PoS data, inventory data, and external macroeconomic data.
Once data sources and mappings are documented, users can ask questions against the Dataverse using natural language and co-create analytic content in an intuitive self-service environment. This empowers business users to iterate on reports quickly without needing IT involvement. Users can ask questions and create responsive dashboards that are dynamic and capable of rendering over 10 million transactions quickly in the front end. This true enablement allows business users to focus on high-priority items. Once a reliable report is created, it can be saved, and as new data is integrated, B/eye provides comparative snapshots to identify trends, anomalies, and key areas of focus, helping users find those needles in the haystack.
At B/eye, our goal is to lead the GenBI space by delivering significant ROI to SMB customers at a cost lower than that of a single full-time employee (FTE). We onboard customers within two business days, ensuring that our features and workflows are intuitive, meaningful, and devoid of unnecessary noise—exactly what SMBs need. Accurate and timely decisions help businesses grow, differentiate from competition, and gain a competitive edge. Try B/eye today. Reach out to me personally or visit our website to learn more.